

Executive Summary
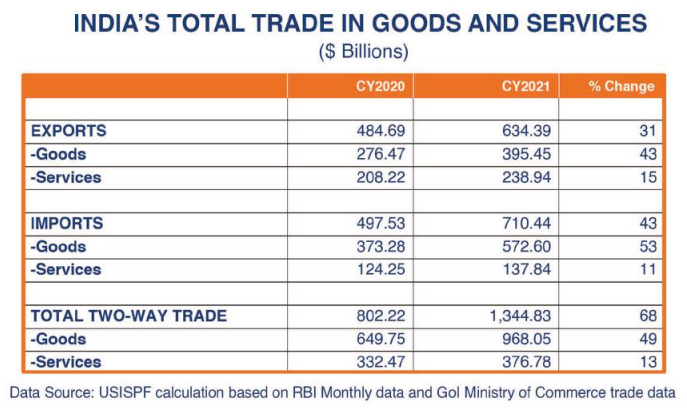
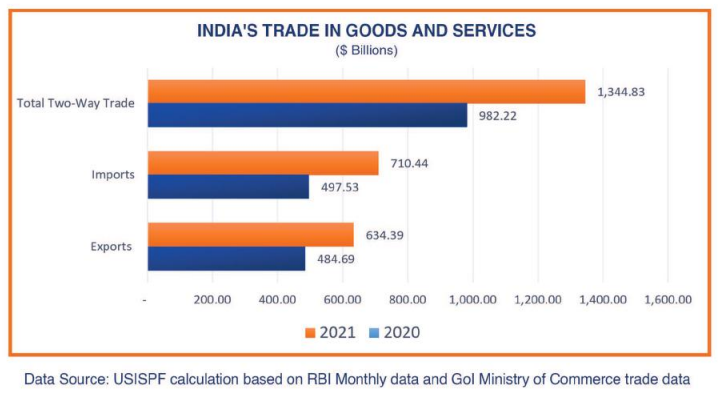
Since India’s liberalization move in 1990-91, increased global integration, FDI and liberalized services sector have led to a steady rise in India’s trade in both merchandise and services. India’s total two-way trade (exports and imports) for CY2021 stood at $1,344.8 billion. This Report offers an analysis of India’s trade patterns while suggesting measures to aid India’s foreign trade.
India’s export basket has included diverse products and has been growing competitiveness in many new industrial categories vs. the traditional products. India’s goods exports expanded 43% year-on-year in 2021, including major items such as, mineral fuels (oil), gems & jewelry and engineering machinery/components that together accounted for 30% share in total exports. Notably, oil exports more than doubled to $56.2 billion in 2021. Raw materials/intermediates and capital goods make up a major part of India’s exports today; utilization of these raw materials by manufacturers within India can help India move up the value chain. In view of the increasing global demand for electronics, India’s export basket needs to have more tech-based products.
The structure of the imports basket is somewhat like that of export products, with mineral oils, gems & stones and machinery/components as top imports. India’s total goods imports in 2021 rose more than 53% to $572.6 billion. With almost 30% share in total goods imports, oil imports for the last few years have been on the uptrend. Other major imports in 2021 included precious/semi-precious stones/metals (15% share) and electrical machinery (10% share). It is observed that finished products have a noteworthy presence in India’s imports.
The analysis of India’s merchandise trade shows that the U.S. remains India’s top bilateral trading partner with total two-way trade of $112.6 billion in 2021, followed by China and UAE. While India continues to enjoy trade surplus with the U.S., trade deficit with China has kept Indian policymakers overwhelmed for the last one decade.
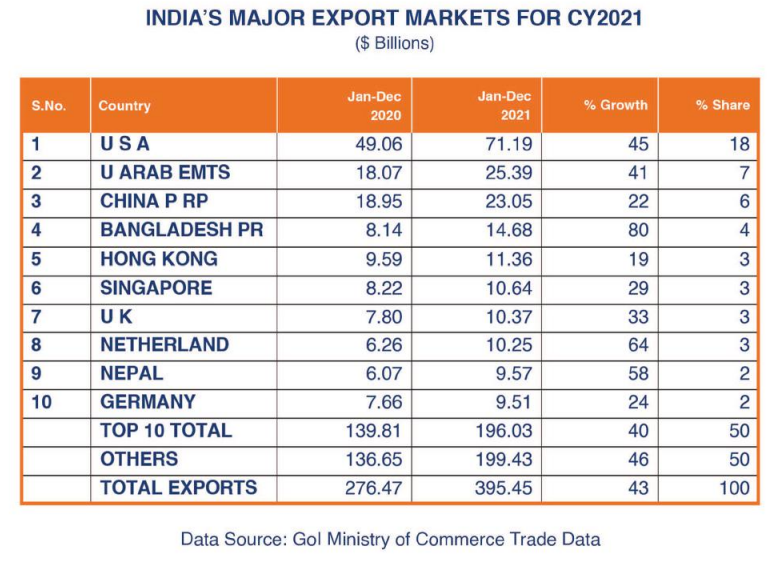
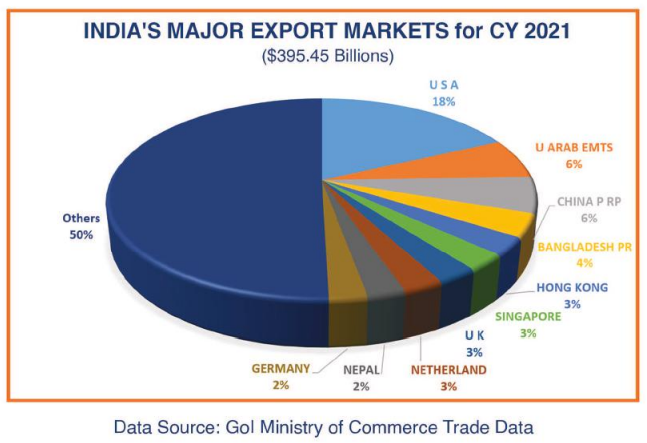
India’s major export markets in 2021 were USA, UAE, China, Bangladesh, and Hong Kong. Exports to the US continued to dominate (share of over 18%) in India’s total goods exports in 2021. India’s top five sources were China, UAE and USA, Switzerland, and Saudi Arab.
The U.S. is India’s top trading partner in terms of both goods and services with more than 12% share. A USISPF Bilateral Trade Report in 2019 estimated $177.7 billion worth of total bilateral trade between the U.S. and India by 2021 at an average 7.5% compounded annual growth. After declining 17% in 2020 (pandemic year), the U.S.-India bilateral trade has recovered 32% in 2021 to $159 billion, indicating mutual interest among the U.S. and India’s businesses even without a trade agreement; USISPF suggests augmenting efforts to make a meaningful progress on the Trade Policy Forum (TPF) work plans throughout the year to resolve the lingering issues. In addition, facilitating entry/expansion of US investments while addressing specific concerns raised by the US investors can help increase bilateral trade flows to reach aspirational goals of $500 billion.
India has tremendous potential in services trade that remains unexploited due to the continuing restrictive policy regime. Reforming the banking, insurance, legal, architectural, accounting, broadcasting and transport services will help increase India’s services trade.
USISPF supports PM Modi’s vision for boosting India’s export sector through impetus to develop the manufacturing sector, attracting GVCs. Recently the Ministry of Commerce has pronounced an ambitious target of achieving exports worth $2 trillion by 2027 while increasing India’s share in the global trade to 10%. Given the longer-term bright prospects of the economic growth of India, achieving these aspirational goals is possible if the Indian policymakers make and implement a focused strategy while addressing tariff and non-tariff trade barriers, opening specific services, increasing India’s manufacturing competitiveness through government support, FDI & technology, augmenting efforts for a freer merchandize trade, and improving ease of doing business.
Geopolitical challenges (US-China Trade war, Russia-Ukraine war disruptions, etc.), COVID-driven supply chain constraints, and steep shipping costs due to unprecedented hike in international oil prices may impact India’s foreign trade performance in the near term.
Recent Developments in India’s Foreign Trade
Since the launch of India’s liberalization in 1990-91, the country’s trade engagement has increased significantly merchandize exports have increased more than 28 times and imports almost 29 times; likewise, service exports have grown from $52 billion in 2005 to $239 billion in 2021 and service imports at almost $138 billion in 2021 have more than doubled from $61 billion in 2005. India’s exports and imports of goods and services in CY2021 stood at $634.4 billion and $710.4 billion, respectively. Increased global integration, FDI and a liberalized services sector have led to a steady rise in India’s trade in both merchandize and services. While India has maintained a strong services trade surplus, the high merchandize trade deficit remains a persistent challenge for Indian policymakers.
India’s total trade dipped 6.8% in the pandemic year 2020, yet better than the WTO forecast of -9.2% in global trade. Despite the initial economic downturn during the first six months of 2021, India’s total trade for the whole year witnessed expansionary trends, developing in certain sectors and destinations owing to market demand and supply chain changes.
India’s Trade in Goods
Export Goods Basket
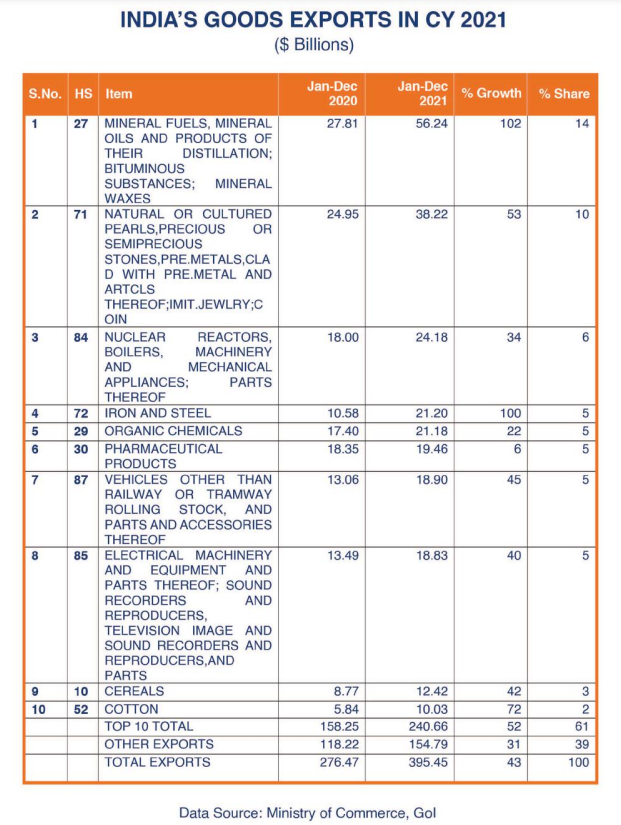
India’s export basket includes diverse products and has been growing in competitiveness in many new industrial categories, such as mineral oils, engineering items, iron and steel, and vehicles, compared to the traditional products, such as textiles and apparels, carpets, and agriculture products. Since 2016, the top ten products in India’s export basket include:
- Mineral fuels/mineral oils
- Gems and jewelry (Stones and natural/cultured pearl products and jewelry)
- Machinery/engineering items
- Iron and steel
- Organic chemicals
- Pharmaceutical products
- Electrical machinery/equipment
- Vehicles other than railway/parts and accessories
- Articles of apparel and clothing accessories
- Cotton
Some noteworthy changes in the export basket over the last few years:
- Seafood exports have been rising
- Auto and Auto Component exports share of 4.8% is now at par with that of electrical machinery due to increased exports of passenger vehicles
- Organic chemicals have shown a steady rise in export growth
- Stone and natural/cultured pearls products have remained India’s top exports
Trends in Merchandize Exports in 2021
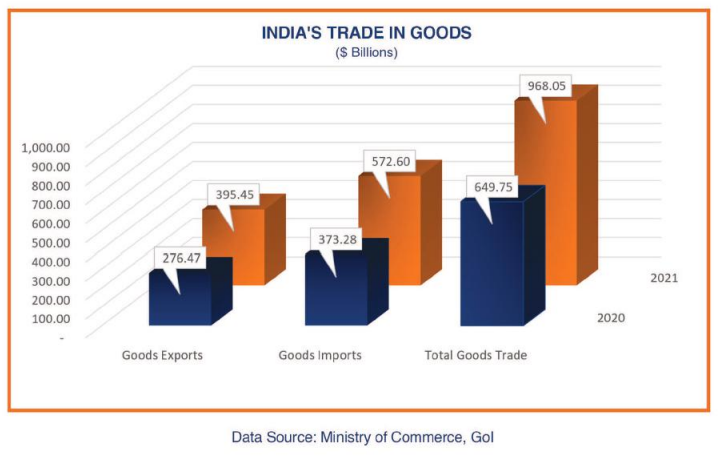
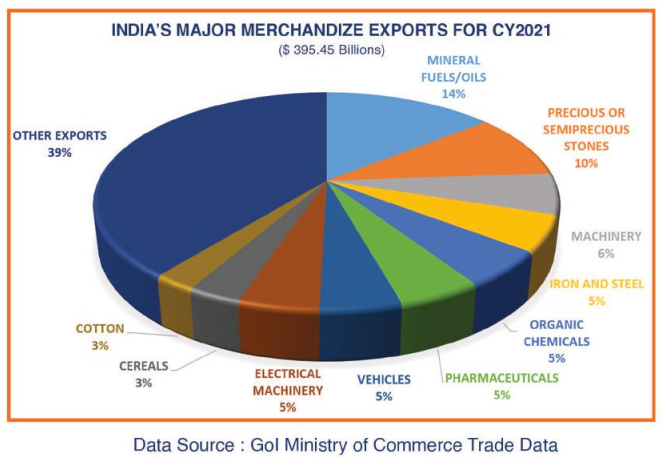
- India’s goods exports in 2021 totaled $395.45 billion, expanding 43% from 2020
- Among the top exported items, mineral fuels (oil), gems and jewelry and engineering machinery/components accounted for 30% share in total exports
- Oil exports more than doubled to $56.24 billion in 2021, retaining the top rank in total commodity exports consecutively for the second year
- Impressive growth rates were recorded for gems & jewelry exports (53%) and machinery (34%), mainly due to the lifting of the pandemic restrictions and increased global demand
- Iron and Steel exports doubled to $2.20 billion; its share in total exports has jumped to 5.4% in 2021 from 3.8% in 2020, mainly due to the restored construction activities following the pandemic restrictions
- Growth in pharmaceutical exports slowed to 6%, slipping to the 6th position in 2021 from the 3rd most exported category recorded in 2020, when the category was boosted by pandemic-driven demand
- Cereal exports, with a 2.5% share in total exports, appeared in top ten exports group for the first time, replacing apparels
- Other products that recorded export growth of more than 50% in 2021 include railway equipment, cotton, aluminum, copper, sugar, paper, wood, furniture, and metals
Import Goods Basket
The structure of the import goods basket is somewhat like that of the export basket, as the top three product groups are the same in each. The major products in the import basket are:
- Natural/cultured pearls, precious/semi-precious stones, precious metals
- Mineral fuels/oils
- Machinery/components/engineering items
- Organic chemicals
- Plastic and articles
- Electrical machinery/equipment
- Iron and steel
- Edible oils
- Medical devices
- Inorganic chemicals
Trends in Merchandize Imports in 2021
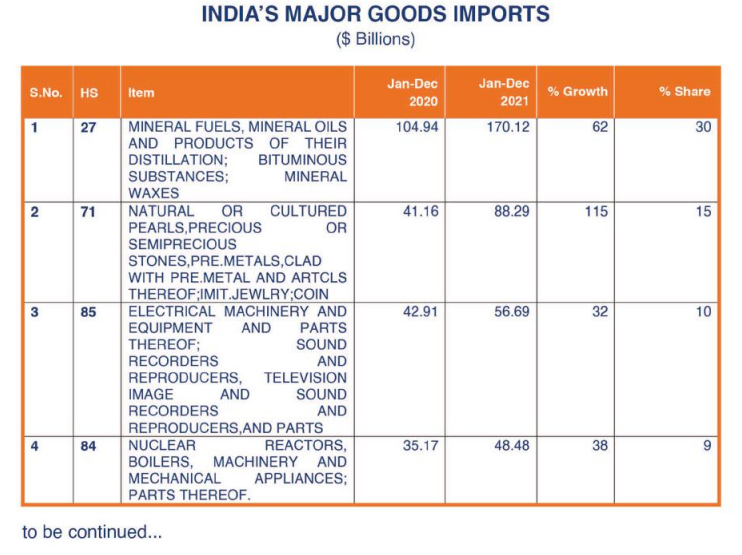
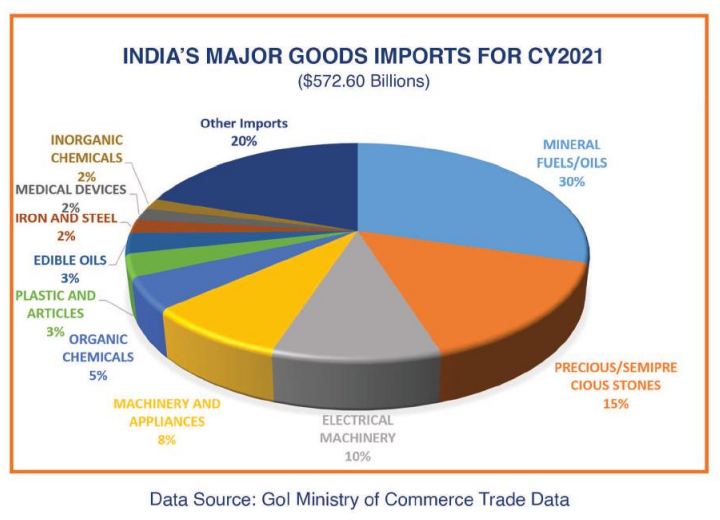
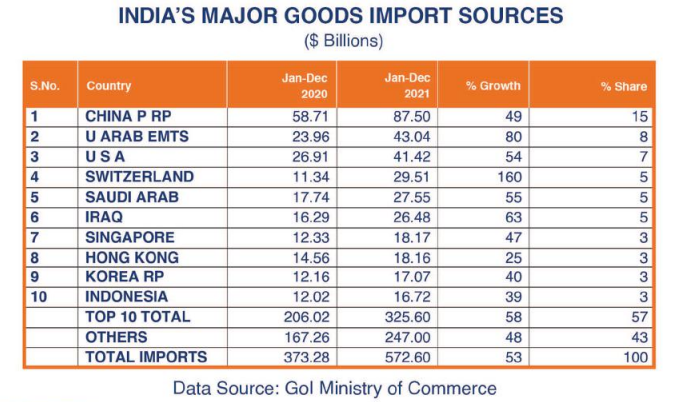
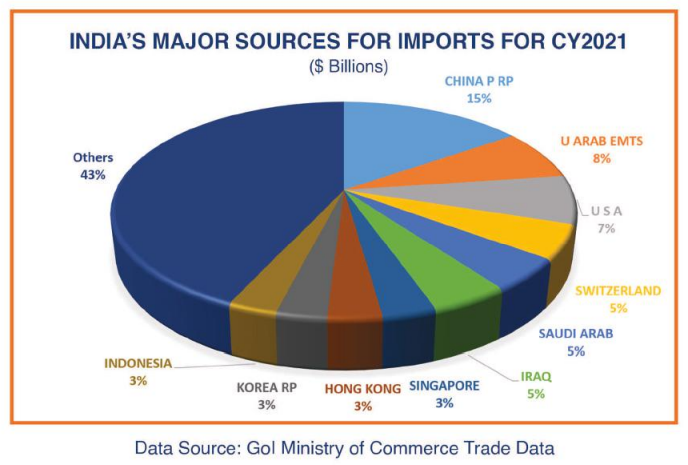
- India’s total goods imports in 2021 rose more than 53% to $572.60 billion
- Mineral fuels/oils were the top import category, with almost 30% share in total commodity imports. India sources about 80% of its crude oil supplies from other countries
- Precious stones/metals and electrical machinery remained the other top imported items, with a share of 15% and 10% respectively, in total merchandize imports
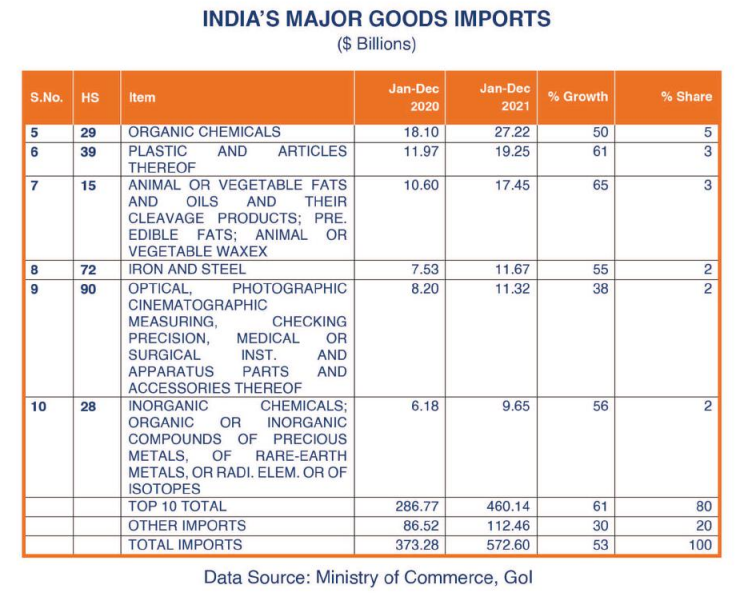
- Edible oil imports swelled nearly 65%
- More demand for chemicals, plastics and iron and steel items led to increased imports, affirming increased industrial activity during the year
Commentary and Recommendations:
A closer analysis of India’s trade patterns indicates that raw materials, intermediate goods, and capital goods make up a major part of India’s exports, while finished products have a noteworthy presence in the import basket. Although continued exports of inputs can increase India’s exports volume, it will not move India up the value chain; instead, it will benefit the importing countries. India needs to upgrade its manufacturing sector through developing a strong eco-system for to be able to utilize its inputs to make finished products not only for India, but also for the world. Today, the global importers have high demands for tech-products. USISPF believes a developed Indian manufacturing sector with liberalized labor laws can attract Global Value Chain participants who will bring the benefits of technology and scale production and increase India’s share in the global trade.
Another observation worth noting is that total imports have grown faster than exports. Exports are growing every year, contributing about 20% in India’s GDP; however, India’s share in global merchandize exports remains below 2% while its share in services exports is above 3%. PM Modi’s announcement in August 2021, laying out his vision of the strategy to boost exports, also acknowledged the impetus to develop the manufacturing sector to attract Global Value Chains (GVCs) and provide jobs. The PM’s vision, if implemented in its real spirit, can move the needle to see a meaningful increase in India’s share in global exports.
Tariff and non-tariff barriers have also constrained India’s share in global trade. India’s import tariffs on goods have risen since 2017 and are viewed as relatively high in the global market. The high cost of intermediate imports impacts not only the manufacturers and GVCs but also makes the products more expensive for consumers. High import duties will effectively hobble India’s efforts to become an export hub. USISPF recommends reducing the tariffs on electronics and electrical components to increase India’s competitiveness for GVCs.
India’s Trading Partners
The United States is India’s top trading partner in terms of both goods and services. In 2021, the US share in India’s total Goods and Services two-way trade was more than 12% at $159 billion. A USISPF Bilateral Trade Report in 2019 estimated $177.70 billion worth of total bilateral trade between the United States and India by 2021 at an average 7.5% compounded annual growth. While US-India bilateral trade declined 17% in 2020 (pandemic year), it has increased almost 32% in 2021, nearly bouncing back to the average growth level. India’s total exports to the United States, at $102.36 billion, and imports from the United States, worth $56.67 billion, generated a trade surplus of $45.69 billion in 2021. These numbers suggest there is mutual interest among US and India’s businesses even without any trade agreement, and the prospects of their enhanced trade partnership appear bright as the two sides converge to solve contentious issues.
India’s Major Export Destinations in 2021
- The main export markets for India are USA, UAE, China, Bangladesh, Hong Kong, Singapore, UK, and the Netherlands. Goods exports to the United States continued to dominate with a share of over 18% of India’s total goods exports in 2021, increasing by a significant 45% from the previous year
- The US remains India’s top trading partner in services, accounting for more than 15% of its total services trade. India’s services exports to the US recovered 12% to nearly $29 billion in 2021 while imports rose 2% to $16.72 billion
- UAE, with a 6.4% share in total goods exports, rose back to its second rank, taking over from China, in
- Exports to UAE dropped significantly in 2020
India’s Major Sources for Imports in 2021
- For merchandize imports in 2021, India’s top three sources were China, UAE and USA, followed by Switzerland, Saudi Arab and Iraq
- China, with a 15% share in India’s total merchandize imports, remains its top supplier for electrical machinery and equipment, chemicals, plastics, and iron ore & steel
- The United States, with a share of 7% in India’s total goods imports, is a relatively new entrant in India’s oil imports
- While UAE, Saudi Arab, and Iraq continue to be crude-oil suppliers to India, their shares in India’s total oil imports have declined
- Imports from Switzerland have risen enormously for the last two years, mainly on account of bigger gold imports
- Imports from Singapore and Hong Kong have witnessed significant growth for the last three years, probably due to re-routing of Chinese goods
Commentary and Recommendations:
On closer analysis of India’s merchandise trade, it is noted that the United States remains India’s top bilateral trading partner with total two-way trade of $112.62 billion in 2021, followed by China ($110.50 billion) and UAE ($68.40 billion). India is also a major services supplier to the United States. While India continues to enjoy a trade surplus with the United States, its trade deficit with China has kept Indian policymakers overwhelmed for the last one decade. In addition, Singapore and Hong Kong have emerged as additional East Asian countries from which Indian imports have been on the uptrend since 2018.
India’s main imports from China include electrical and mechanical machinery, Active Pharmaceutical Ingredients (APIs), auto components, and medical supplies. India is keen to reduce its trade deficit with China and has been trying to gain market access for India’s IT and pharmaceutical products. Also, to reduce imports of APIs and medical devices from China, the Indian government in 2020 approved Production Linked Incentive (PLI) Schemes, encouraging domestic production and exports.
India announced its intent to increase its trade engagement with North America, European Union (EU), and Africa, rather than the countries of East Asia, when it withdrew from the Regional Comprehensive Economic Partnership (RCEP) in 2019. India is currently focused on free trade agreement (FTA) negotiations with the UK, EU, and UAE.
While a mini trade deal between India and the United States has been shelved for now, both partners have decided to enhance the engagement through the Trade Policy Forum (TPF) and other Track-1 cooperation tools to resolve the lingering market access and digital trade issues. Industry from both sides view numerous business opportunities and believe the resolution of these issues will be an important building block for an FTA in the future.
USISPF suggests enhancing efforts to make a meaningful progress on the TPF work plans throughout the year. In addition, if India can facilitate entry and expansion of US investments through addressing specific concerns raised by the US investors, bilateral trade flows can be expected to reach India’s aspirational goal of $500 billion. According to an OECD study, FDI and trade are complementary to each other; FDI has a net positive impact on exports in the long-term due to the transfer of technology, better access to international markets, increasing domestic capital and capacity building of the local workforce.
Observations on US-India Bilateral Trade in Goods
- US merchandize exports to India in 2021 equaled $41.42 billion, up 54% from $26.91 billion from 2020
- US imports from India in 2021 equaled $71.20 billion, up 45% from $49.06 billion from 2020
- Total bilateral trade in goods in 2021 equaled $112.62 billion up 48% from $75.97 billion from 2020
- While the United States is India’s top trading partner, India is 9th biggest trading partner of the United States.
- Mineral (crude oil) fuels exports accounted for the biggest share (35%) in total US exports to India in 2021
- Other major US exports to India included precious stones/metals (18% share), machinery (6% share), organic chemicals (5% share), and electronics (4%)
- Top US imports from India in 2021 were precious stones (22%), pharmaceuticals (12%), textiles (11%), machinery (7%), and electronics (5%)
Trade in Services
India’s services sector is the key driver of its economic growth, contributing more than 54% to India’s GDP. India’s trade in services has been a major component of its total global sales over the past 25 years, and India is now a prominent supplier of computer, telecommunications, information, commercial and travel services. India’s services trade to GDP ratio is 13.2% in 2021, and its service exports account for 3.5% of global exports of services. India has maintained trade surplus in services trade in major service categories.
Despite the pandemic impact, India ranked 7th in leading exports of global commercial services in 2020, according to the WTO.
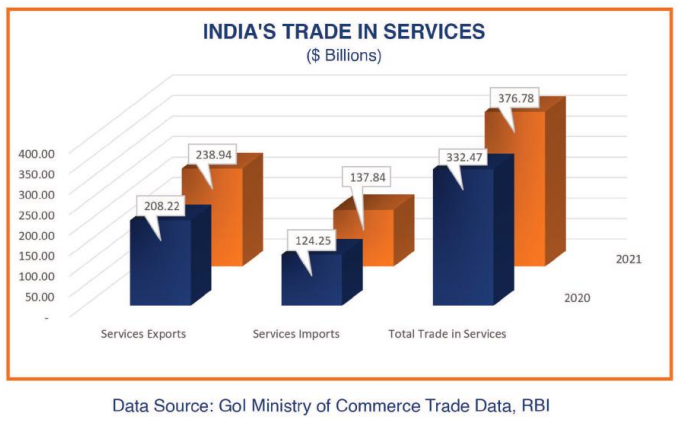
- India’s trade in services is estimated at $376.78 billion in 2021, accounting for 28% of its total trade
- India’s services exports stood at $208.22 billion in 2020, and are estimated at $238.94 billion in 2021, growing 14.75% Services imports by India are up almost 11% in 2021 to $137.84 billion, from $124.25 billion in 2020
- India’s services trade balance in 2021 shows a surplus of $101.10 billion
- India’s major services export markets are the US, UK, and Japan
Commentary and Recommendations
India has tremendous potential in services trade that remains unexploited due to the restrictive policy regime followed in various sector segments. In the latest OECD Services Trade Restrictiveness Index, India’s average score for the services sector, at 0.378 in 2021, has improved slightly from 0.394 in 2019; however, India remains far more restrictive than all the OECD countries, and appears in the top three most restrictive markets in respect of services, after only Indonesia and Thailand among the non-OECD countries. USISPF recommends reforming services subsectors, such as banking, insurance, legal, architectural, accounting, broadcasting and transport services, that should help increase India’s services trade. That said, India’s stellar performance in computer services vouches for its competitiveness in software and telecom services.
India’s Foreign Trade Outlook
India’s Foreign Trade Policy (FTP) targets goods and services exports of over $1 trillion by Indian Fiscal Year (IFY) 2026-27. The new FTP (to be announced later in 2022) will, reportedly, provide government support to leverage the rebound in global economic growth. Recently the Ministry of Commerce has also flagged the ambitious target of achieving exports worth $2 trillion by 2027 and increasing India’s share in world trade to 10% from the current 5.3%. Given the bright prospects of economic growth of India, achieving these aspirational goals is possible if Indian policymakers implement a focused strategy, such as the PM’s Vision on Export Strategy, and other appropriate measures, such as removing trade barriers through industry consultations, further opening of specific services, increasing India’s manufacturing competitiveness through government support, foreign direct investment and technology, augmenting efforts for freer goods trade, and improving the ease of doing business through use of technology.
The new FTP for 2022-27 is expected to focus on ensuring greater integration with the global supply chain and reducing logistics costs. USISPF hopes that the GOI will continue to facilitate trade and manufacturing through its policy support and incentive schemes. We acknowledge the recent Budget announcement of an increased focus on capital expenditure that will help the country’s manufacturing and trading community. That said, COVID-driven supply chain constraints, geopolitical challenges (US-China Trade war, Russia-Ukraine war disruptions, etc.), and steep shipping costs due to the sharp hike in international oil prices may not exclude India, impacting its foreign trade performance in the near term. India will likely have opportunities to expand exports of specific commodities after the end of the Ukraine-Russia war, and Indian exporters may also benefit from weakening Indian Rupee against the US Dollar. Overall, India, being a major crude oil importer, will likely have a higher-than-expected current account deficit if the international oil prices remain elevated.
