
Key Points
Trade in Goods and Services
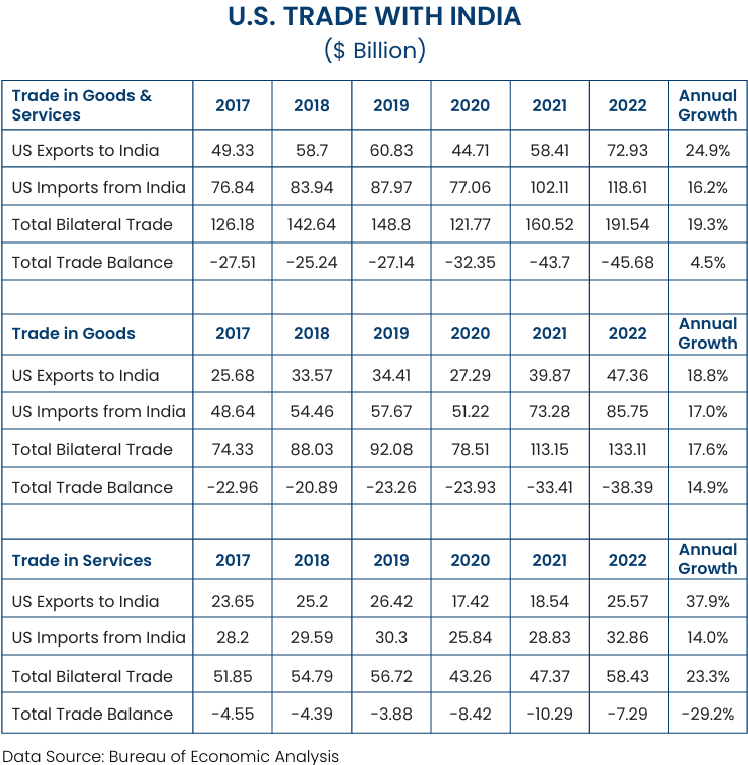
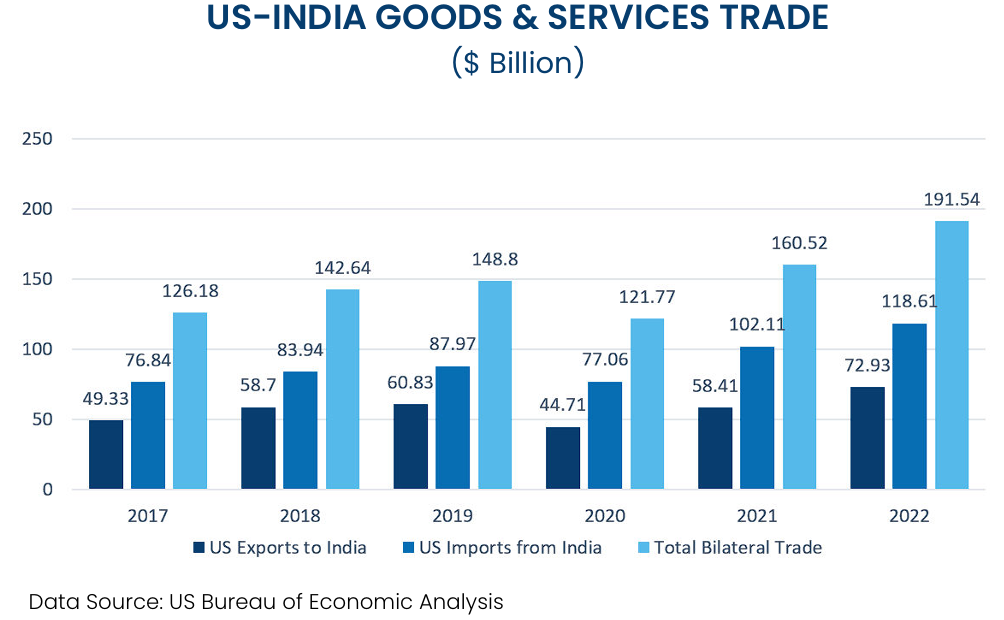
- US total bilateral trade (goods and services) with India was circa $192 billion in 2022, very close to USISPF projections ($191.2 billion). The two-way trade was up more than 19% from the previous year despite the continuing geopolitical challenges and gloomy economic conditions. Bilateral trade grew only 4% in 2019 (just prior to the COVID year), and 13% in 2018.
- US exports of goods and services to India totaled nearly $73 billion in 2022, remarkably 25% more than the 2021 level of $58 billion; total US imports from India, at about $119 billion, jumped 16% from the previous year.
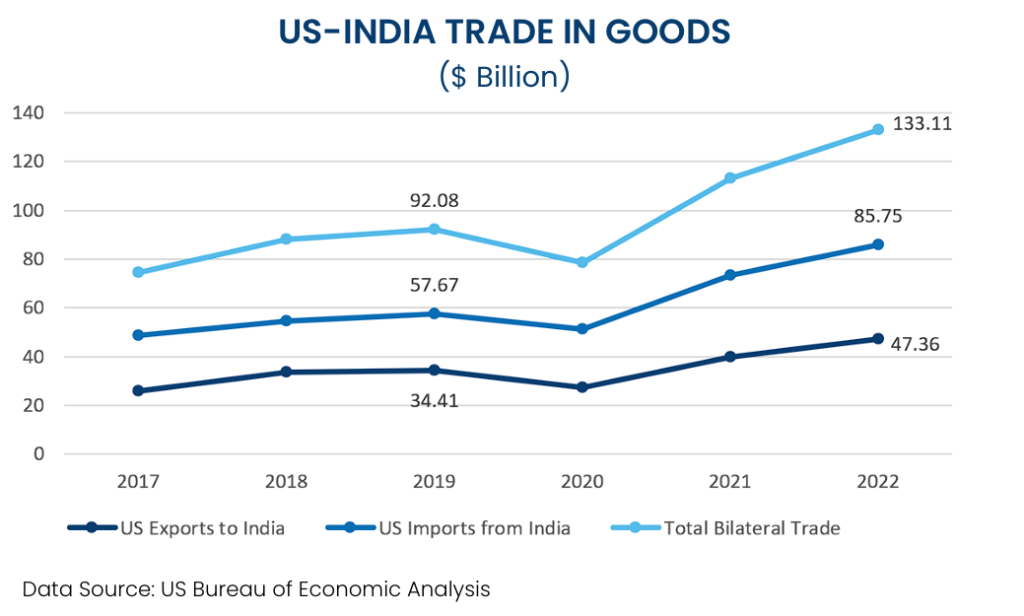
Trade in Goods
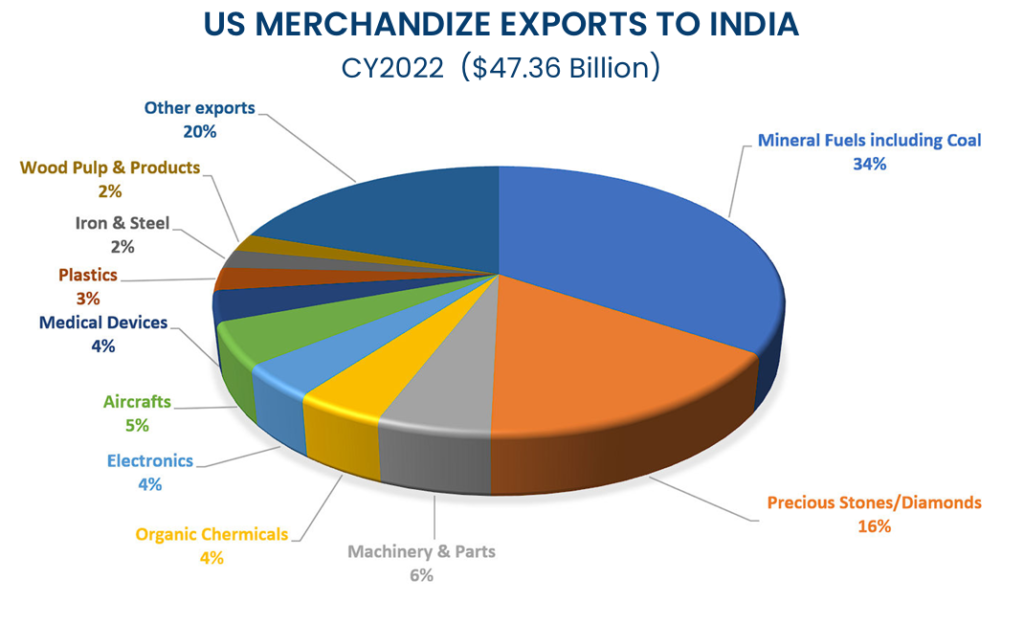
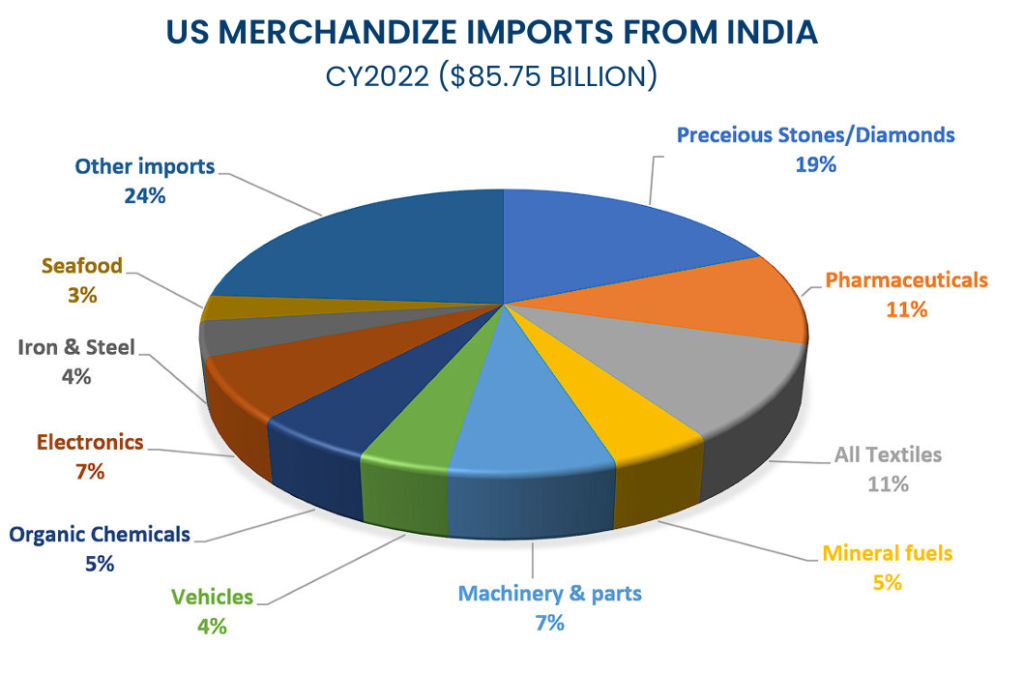
- US-India bilateral trade consists of about 70% trade in goods. Total bilateral trade in goods expanded nearly 18% to more than $133 billion in 2022 from the 2021 level, with more than $47 billion worth U.S. exports to India and about $86 billion imports from India.
- India, with a share of 2.3% of total US goods exports, was the 10th biggest export market for the United States in 2022. U.S. goods exports were majorly driven by crude oil/gas, gems & stones, and machinery exports, printing a drastic increase of approximately 19%
- India accounted for 2.8% of total imports of commodities and items by the United States in 2022, making it the 8th largest source of merchandize imports for the United States. US goods imports from India grew 17% in 2022, including gems & jewelry, pharmaceuticals, textiles, and machinery imports.
- The goods trade balance continues to remain in favor of India.
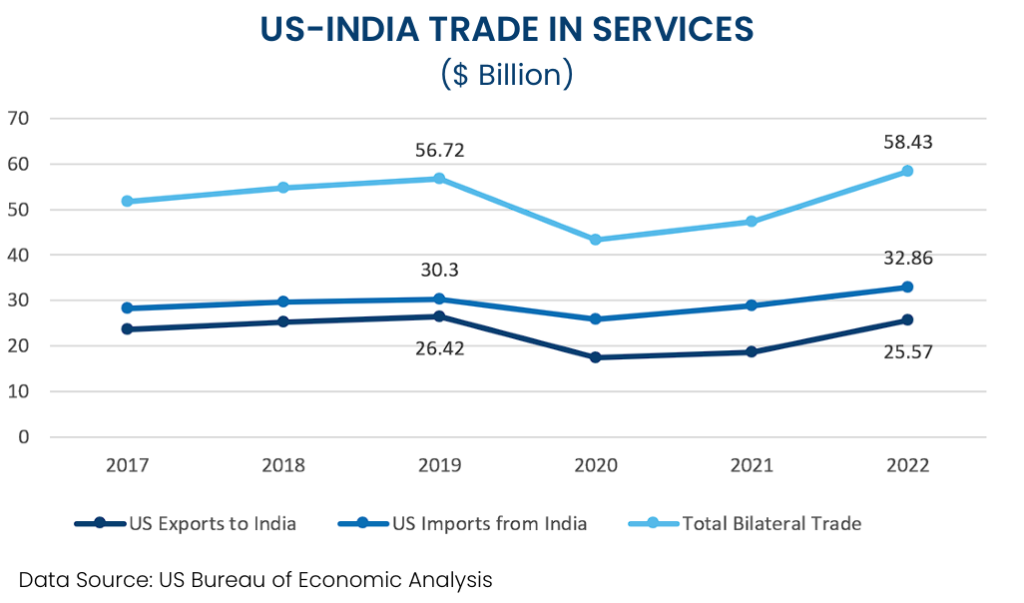
Trade in Services
- The United States’ services trade with India spurred 23% in 2022 to $58 billion, recovering almost to the pre-pandemic level. Due to the pandemic-driven lockdowns in both countries, trade in services was severely affected during 2020 and 2021.
- The trade in services between the two partners is relatively more balanced than that in goods. The U.S. exports of services to India went up 38% to nearly $26 billion, while imports from India increased 14% to $33 billion in 2022.