

About US-India Strategic
Partnership Forum
The US-India Strategic Partnership Forum (USISPF) is a non-profit organization, with the primary objective of strengthening the U.S.-India commercial and strategic partnership.
The Executive Board came together in 2017 to establish USISPF with the purpose of enabling business and governments to collaborate and create meaningful opportunities that can positively change the lives of citizens. The formation of USISPF signals a new chapter in U.S.-India relations. Dedicated to strengthening economic and commercial ties, USISPF plays a significant role in fostering a robust and dynamic relationship between the two countries through policy advocacy that will lead to driving economic growth, entrepreneurship, employment-creation, and innovation to create a more inclusive society.
To achieve these goals, USISPF works closely together with businesses and government leaders, both at the local as well as federal levels. We work to educate government leaders and lawmakers in both countries on issues relating to the U.S.-India commercial and strategic partnership. With regard to Corporate Social Responsibility, we work with businesses, NGOs and independent organizations to enable inclusive growth and enhance long term development goals.
USISPF has an established presence across both countries, with teams in New York, Silicon Valley, Washington DC, Mumbai, and New Delhi.
INTRODUCTION
While September 2018 marked the inaugural 2+2 Dialogue between the United States and India formalizing the strategic relationship, signs of a positive trajectory between the two partners started appearing earlier on, with burgeoning bilateral trade over the last few years. Currently, the U.S.-India trade relationship is at its highest point with both economies witnessing positive growths in their bilateral trade volumes.
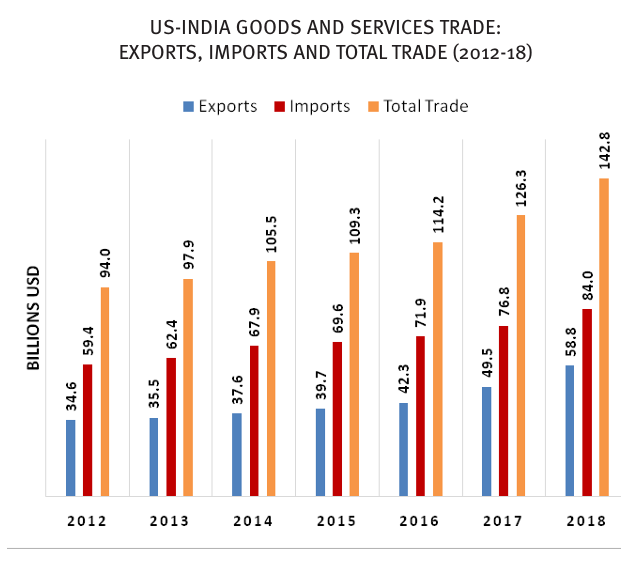
Total bilateral trade of goods and services increased 5.6% on an average annual basis for the period 2012-2016; however, double-digit growth rates of 2017 and 2018 pushed up the annual average growth rate (AAGR) to 7.4% between 2012 and 2018. This growth in bilateral trade was accelerated by services trade, which grew at an AAGR of 9.4%. Meanwhile, goods trade grew at an AAGR of 6.4% over the same period. The U.S.-India trade balance has grown 3.8% on an average in favor of India, from $24.8 billion in 2012 to $25.3 billion in 2018; it has been on the decline since its 2014 peak of $30.2 billion.
Despite 18 disputes since the inception of WTO and several ongoing trade policy issues, the U.S.-India bilateral trade numbers are witnessing an upward trend, suggesting that a vast potential remains untapped and can be achieved with policy measures to remove existing trade barriers on both sides.
INDIA-US BILATERAL TRADE REPORT
CURRENT
TRENDS &
ANALYSIS
- U.S. total bilateral trade (goods and services) with India was $142.8 billion in 2018, up 13.2% from $126.2 billion level in 2017. Bilateral trade witnessed an average 7.4% annual growth rate for 2012 and 2018.
- U.S. exports of goods and services to India totaled $58.8 billion in 2018, registering a robust 19.1% increase from the 2017 level of $49.3 billion; total U.S. imports from India, at $84 billion, rose 9.4% from $76.8 billion in 2017.
- Total U.S. exports growth rate in 2018 at 19.1% was more than four fold the average export growth rate of 4.7% achieved for the previous 5 years; total U.S. imports from India grew at a slightly higher rate of 9.4% from the average import growth rate of 6.2% for the corresponding periods.
OBSERVATIONS DRAWN FROM THESE TRENDS
- The U.S.-India trade relationship is at its highest point currently with both economies witnessing positive growths in their bilateral trade volumes. The trade numbers appear to be moving on a relatively balanced trade trajectory.
- A significant growth rate in U.S. exports of goods and services to India in 2018, coupled with a relatively lower growth rate in U.S. imports from India, has resulted in an 8%-reduction in U.S. trade deficit (to $25.3 billion) from the 2017 level of approximately $27.5 billion.
BILTERAL
TRADE
PROJECTIONS
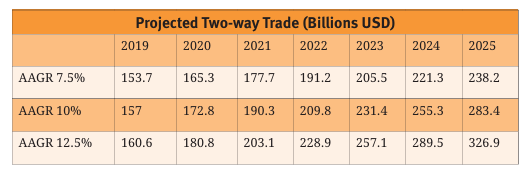
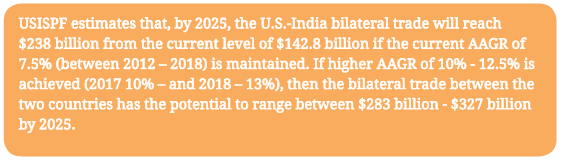
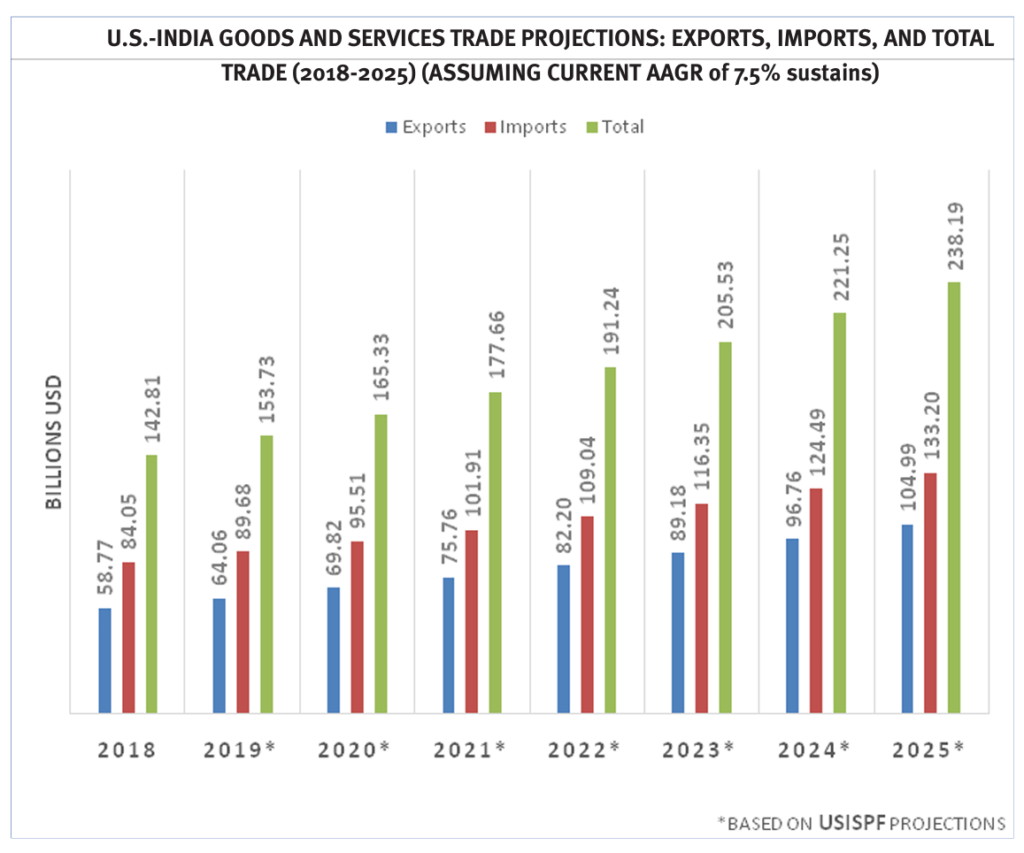
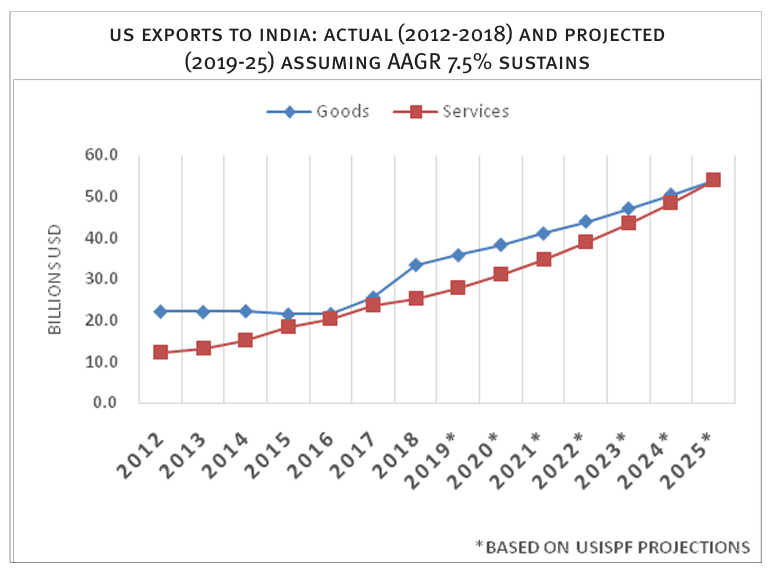
The overall bilateral trade patterns point to increased engagement in the short-mid term between the two countries. USISPF estimates that, by 2025, the U.S.-India bilateral trade will reach $238 billion from the current level of $143 billion even if the current annual average growth rate (AAGR) of 7.5% (between 2012 and 2018) is maintained in two-way trade. If higher AAGR of 10%-12.5% (as witnessed in 2017 and 2018) is achieved, then the bilateral trade between the two countries has the potential to range between $283 billion and $327 billion by 2025. In line with the current trends and huge impending deals in aerospace and petroleum & gas sectors between the two economies, the volume of bilateral trade is likely to increase in the short to medium terms.
TRADE BALANCE
- Trade in Goods: Total U.S.-India bilateral trade in goods grew 18.4% to $88.1 billion in 2018 over the 2017 level, with $33.6 billion worth U.S. exports to India and $54.5 billion U.S. imports from India. This 18.4% growth rate was almost five times the average growth rate between 2012 and 2016. In 2018, U.S. goods exports witnessed a whooping 30.7% growth while U.S.imports of goods from India rose 12% from the 2017 level. As a result, goods trade deficit with India diminished 9% to $20.9 billion in 2018 from the previous year’s $23 billion.
- Trade in Services: The U. S. services trade deficit with India was $4.4 billion in 2018, down 4% from the 2017 level of $4.6 billion. Total bilateral trade in services at $54.8 billion grew 5.7% over the previous year, with $25.2 billion worth U.S. exports to India and $29.6 billion imports from India. 2018 U.S. exports of services to India growth at 6.6% was balanced with 4.9% growth in US imports from India, pointing to a rising and consistent engagement on service trade from the U.S. side.
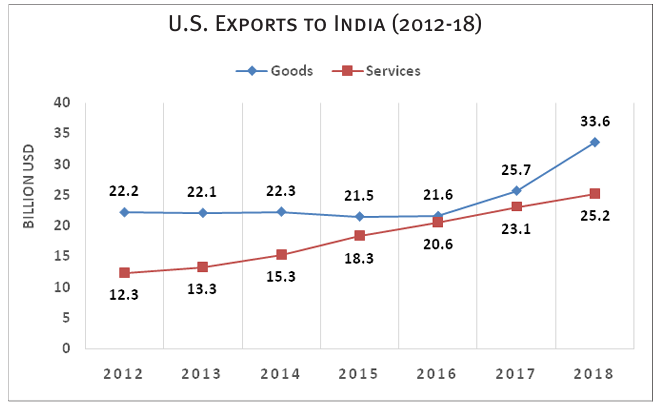
U.S. EXPORTS TO INDIA
- India was 13th largest goods export market for U.S. exporters in 2018. The U.S. exports were $33.6 billion in 2018, up 30.7% from the 2017 level of $25.7 billion. This is the highest annual growth rate on record in U.S. exports to India for more than a decade. However, U.S. merchandize exports to India accounted for only 2% of overall U.S. global exports in 2018.
- The top U.S. export categories (2-digit HS) to India in 2018 were: precious metal and stone (diamonds) ($7.9 billion), mineral fuels ($6.2 billion), aerospace …..($3 billion), machinery ($2.2 billion), and optical and medical instruments ($1.6 billion).
- In 2018, the U.S. sales of aerospace products rose to $2.9 billion from $2.14 billion in 2017.
- U.S. exports of services to India were $25.2 billion in 2018, 6.6% more than the 2017 level.
Despite 18 disputes since the inception of WTO and ongoing several trade policy issues, the U.S.-India bilateral trade numbers are witnessing upward trends, suggesting that a vast potential remains untapped. A break through can be achieved if both sides undertake policy measures to remove trade barriers.
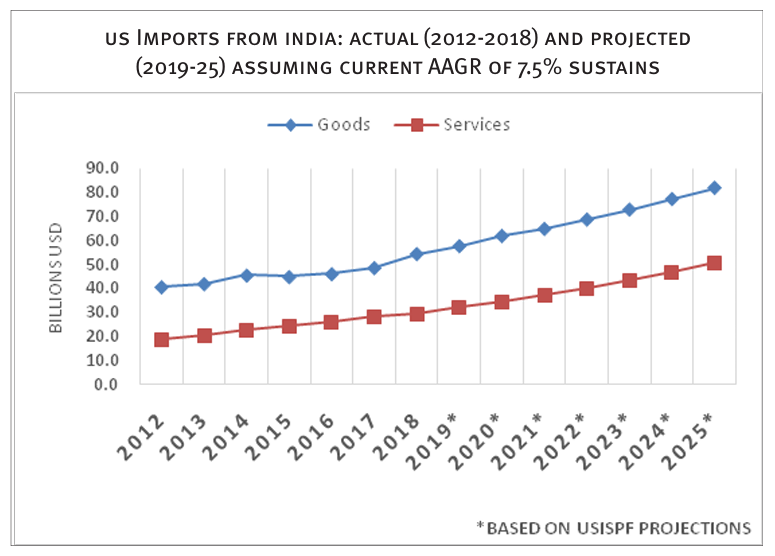
U.S. IMPORTS FROM INDIA
- India was the United States’ 10th largest source of goods imports in 2018. U.S. goods imports from India totaled $54.5 billion in 2019, up 12% from 2017. U.S. imports from India accounted for 2.1% of overall U.S. global imports in 2018.
- The top U.S. import categories (2-digit HS) from India in 2018 were: precious metal and stone (diamonds) ($11.6 billion), pharmaceuticals ($6.5 billion), machinery ($3.5 billion), mineral fuels ($3.3 billion), and vehicles ($2.9 billion).
- U.S. imports of services from India were $29.6 billion in 2018, 4.9% more than the 2017 level.
- Total bilateral trade (goods and services) between the U.S. and India increased at an average growth rate (AGR) of 7.4% at $142.8 billion in 2018 from $94 billion in 2012. In this period, the growth in bilateral trade was accelerated by services trade, which grew at an AGR of 9.5%. Goods trade grew at an AGR of 6.4%. During the year 2018, goods trade contributed 62% and trade in services contributed 38% of the total India US bilateral trade of $142.8 billion.
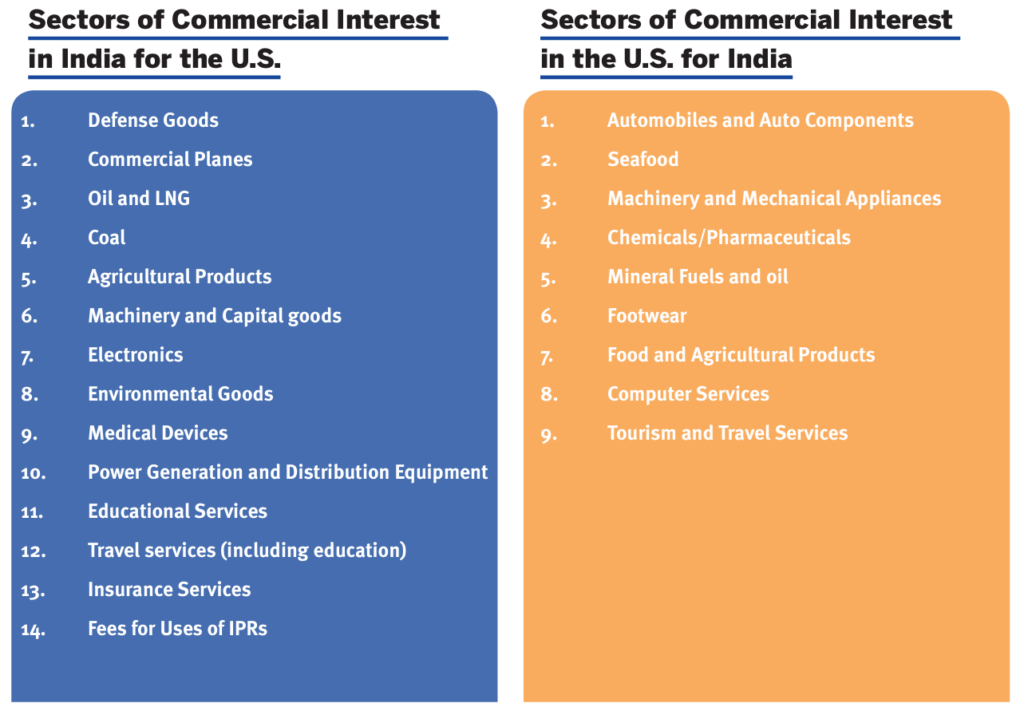
SECTORS OF COMMERCIAL INTERESTS IN INDIA FOR THE U.S. (IN NO PARTICULAR ORDER)
DEFENSE GOODS
The defense sector will play a major role in coming years. The U.S. has reaffirmed India’s status as “a Major Defense Partner” through STA1 and Defense Technology and Partnership Act. This and the signing of COM-CASA during the 2+2 ministerial dialogue will facilitate defense goods and technology exports to India. The Government of India (GoI) Ministry of Defense (MoD) in August 2018 cleared acquisitions worth $660 million for mobile heavy artillery weapon. MoD also announced purchase of 24 Lockheed Martin-Sikorsky MH-60 Romeo maritime helicopters valued at approximately $2 billion during the 2+2 ministerial dialogue that happened in early September 2018 in New Delhi. The additional requirement of Indian Navy is of 123 NMRH and 118 NUH, which will be procured through the Strategic Partnership procedure of the DPP-16. Indian Navy is also looking at adding 12 more naval surveillance aircraft P8i and 22 Sea Guardian UAVs to its inventory. According to defense industry experts India’s defense market is estimated to touch $70 billion in a decade. MoD’s planned expenditure circa $250 billion for acquisitions over the next decade provides tremendous trade and investment opportunities to American Aerospace companies given MoD’s policy to private partnerships in India’s defense market.
The U.S. pre-approved offer to India, for sale of 22 Guardian drones and the partnership to develop and manufacture the F-16 Block 70 in India will boost U.S. export numbers. A major U.S. aerospace manufacturer, Boeing, has also partnered with both public and private sector partners in India to manufacture the F/A-18 Super Hornet. The U.S. has approved a $930 million direct commercial sale of six Boeing AH-64E Apache heavy attack helicopters to India by 2020 for the India Army. Earlier, the contract for 22 Apache for the Indian Air Force was signed in September 2015. Boeing is also in contention to supply 110 fighter aircrafts to the Indian Air Force. According to the Department of State, Indo-US defense trade is expected to grow to $18 billion by 2019 from the current level of $15 billion. In May 2019, India’s total defense procurement was valued at $19.8 billion through 76 foreign contracts.
COMMERCIAL PLANES
Besides defense sales, India’s ever-expanding need for commercial planes present huge business opportunities to the U.S. industry. According to the Directorate General of Civil Aviation (DGCA), India’s air passenger traffic growing at an average 16% annually, reached 140 million passengers in 2017, making it the world’s third largest aviation market. International Air Transport Association (IATA) estimates that India, being the fastest growing domestic market globally, is expected to reach 337 million domestic and 84 million international passengers over the next decade. Industry estimates that domestic traffic will grow five and a half times over the next two decades. Indian carriers are already operating at near capacity. According to the Ministry of Commerce, India’s plans to expand its aviation sector by procuring 1000 planes will present huge opportunities to U.S. aircraft companies. Given these mid-long-term trends, demand for new aircrafts, air navigation service technologies, airport security equipment, and increased infrastructure is going to be created. Boeing estimates a total of $290 billion sales to India over the next two decades for 2100 planes. India’s Regional Connectivity Initiative with an amount of $110 billion in civil aviation expansion and modernization projects through 2020 is expected to offer tremendous commercial opportunities to multinational aviation companies.
OIL & LNG
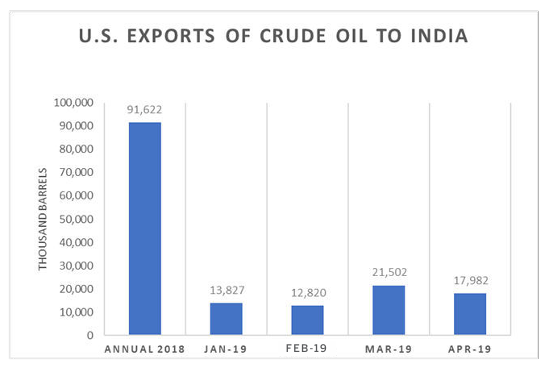
In August 2017 the U.S. for the first time sent a crude shipment to India. Subsequently, Indian oil refining companies have evinced interest in more imports from the U.S. According to the U.S. Embassy estimates, the Indian Oil Public Sector Units have placed orders worth $20 billion, and this is well placed to place an average $4 billion/year worth U.S. exports over the next few years. The United States has also expressed willingness to help India build its strategic petroleum reserves. In the backdrop of the implications of U.S.-China trade war, there will be more opportunities for U.S. crude oil suppliers to divert their exports to India. According to the Energy Information Administration, the U.S. crude oil exports to India at 73 million barrels in 2017 increased to approximately 101 million barrels in 2018. Maintaining the upward trend, the U.S. oil exports in the first quarter of 2019 are estimated at 48 million barrels.
According to industry observers, Indian refiners are now turning to the U.S. supplies for mini deal arrangements to keep a regular flow to meet monthly demand. Private refinery sources in India have reportedly said that an improvement in the U.S. shipping logistics has sharpened their demand on a regular continual basis. Iran Sanctions will likely play a role in oil demand and supplies given India’s major oil imports from Iran. Likewise, there is huge potential for LNG exports to India. India is looking to diverse its gas imports and the U.S. is a favorable choice given the recent U.S. policy change on export of Liquified Natural Gas (LNG) beyond Most Favored Nations. The U.S.-India Natural Gas Task Force is actively working on to increase natural gas penetration in India. All these trends will lead to acceleration in India’s imports of U.S. crude and LNG in coming years.
COAL
On top of 300% growth achieved in 2017, Coal exports from the U.S. to India rose 61% to $1.67 billion in 2018; however, it represented only 7% of India’s total coal imports. Due to environmental considerations India’s imports of thermal coal are rising. Cement industry in India is switching to high-calorific thermal coal following ban on use of polluting petcoke by certain states in North India. The U.S. is emerging as a major source of high-calorific coal for India, and the trend is likely to continue given a strong push for total ban on petcoke by local environmentalists.

Coal is also one of the four “pillars of cooperation” between the U.S. India Strategic Energy Partnership to promote clean coal technologies. China imposed a 25 per cent tariff on imports of U.S. coal in August 2018, as retaliation against tariffs on its exports implemented by the administration of President Donald Trump. As a result, U.S. coal exporters are finding other buyers in Asia, mainly India. Much of the coal China buys from the United States is higher value coking coal, used in steel making.India is world’s second largest steel producer. India imported 15.6 million tons (mt) of coal from the U.S in 2018, 10.2 mt in 2017 and 5 mt in 2016.
India currently meets about 85% of its coking coal demand through imports; India’s National Steel Policy forecasts coking coal demand of 161 mt/annum by 2030 31. Steel industry observers opine that India has to heavily depend on imported coking coal for its plan to produce 300 mt of crude steel by 2030-31.
AGRICULTURE PRODUCTS
The fresh fruit exports from the U.S. were approximately $827 million in 2018. The U.S. sought market access for pork, avocados and cherries in India post U.S.-China trade war through a special “trade package” negotiations. The negotiations related to U.S. steel tariff waiver to India have not yielded any outcome, however, future negotiations, if successful, can restore market access for several U.S. agricultural products (apples, almonds, walnuts, lentils among 29 products, subject to India’s proposed retaliatory tariffs effective June 16, 2019) where future growth trends are looking up-wards. The above-mentioned products are expected to benefit due to rising Indian demand for such products. Likewise, given India’s growing demand for poultry and dairy products, the U.S. poultry and dairy industry are likely to benefit with the recent resolution of WTO case on India’s poultry imports. With hundreds of millions of live-stock, India’s soymeal (animal feed) supply gap can befilled by the U.S. soymeal. The U.S. is one of the major soymeal producers of the world and may face over-capacities in soymeal post China’s tariff barriers. Corn is another product that presents opportunities to U.S. suppliers as India’s reliance on biofuels increases. However, at this moment, India restricts ethanol imports for which corn is used as an input, but this may get resolved in view of rising gap in demand and supply of ethanol in India.
MACHINERY & CAPITAL GOODS
The U.S. exports of machinery and capital goods to India were $2.2 billion, merely 5% of total machinery imported by India in 2018. India’s capital-goods sector is not developed fully yet, so its rising demand for sophisticated capital goods has resulted in dependence on imports. India is emerging as the world’s fastest growing economy focused on advancing its manufacturing sector. According to a McKinsey report one third of the demand for capital good sin India is met by imports.For an economy size of nearly $2 trillion, India’s capital-goods sector, at 0.6% of GDP, offers a significant business opportunity for both Indian and foreign suppliers. More than 50% of the capital goods imports in India are sourced from China, U.S. and Japan. In the wake of the U.S.-China trade war, the U.S. suppliers may likely diversify more exports to India. According to the McKinsey Report India offers 8-10% growth in the capital-goods sector, compared with 2-4% in developed markets.
ELECTRONICS
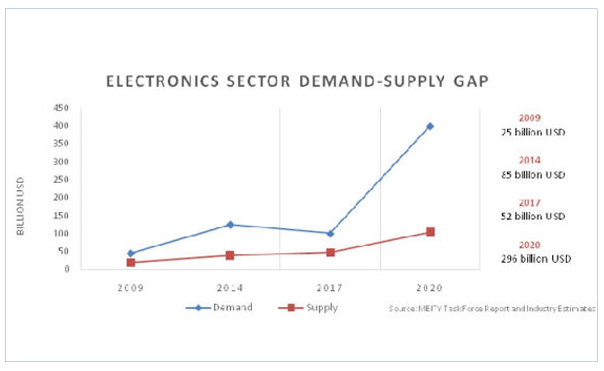
Industry estimates that India is likely to have about 70 metro cities by 2025, requiring modern communication systems and IT products. As Smart Cities Project aggravates, demand for automation in public transportation system and public utilities is likely to grow exponentially. In addition, as India’s middle class expands, more demand for Information and Communication Technology (ICT) products is expected. The U.S. accounted for only $1.54 billion in India’s total electronic imports valued at $52.4 billion in 2018. According to the Ministry of Electronics and IT (MEITY) Task Force Report the rapid growth in the demand for electronics, clubbed with the slow rate of increase in domestic production, has resulted in an increasing demand-supply gap in the industry.
While the demand for electronics stood at $45 billion in FY2009, goods worth $20 billion were produced in India; the gap widened in FY2014 with demand at $125 billion and domestic production at $40 billion. At this rate it is estimated that demand for electronic hardware products will grow to $400 billion by 2020 and production may reach $104 billion, creating a gap of $296 billion which present tremendous opportunities to foreign suppliers.


ENVIRONMENT GOODS
To deal with high air pollution levels India has introduced new requirements that could raise demand for clean tech equipment and environment goods. According to the USITC Top Markets Report 2017, the overall environmental technologies market in India, including goods and services, is valued at $17.87 billion. A McKinsey study estimates that thermal power plants in India will need to spend roughly $15 billion on emission-control equipment such as fuel-gas desulphurization and catalytic reduction over the next five to seven years.
Likewise, management of industrial water will require output water treatment and recycling and reuse systems (the government has already committed $3 billion for the Clean Ganga project to clean India’s longest river). Oil refineries upgrading equipment to meet new emission standards will also require huge investments during the next few years. U.S. suppliers may leverage their modern technology to provide solutions and benefit from these opportunities. Waste management and recycling is underdeveloped in India. India generates about 62 million tons of municipal solid waste (MSW)/year, which includes 5.6 million tons of plastic waste, 0.17 million tons of biomedical waste, 7.9 million tons of hazardous waste, and 1.5 million tons e-waste according to the USITC Top Markets Report 2017. The government has allocated approximately $1.11 billion for solid waste management projects in urban areas, 166 which is about one third of the total estimated amount of investment needed to manage the country’s MSW, according to the U.S. Commercial Service in Kolkata.
MEDICAL DEVICES
U.S. exports of medical devices to India were $407 million in 2018 while India’s total imports of this product were $1.7 billion. While India has a matured pharmaceutical manufacturing, it lags behind in manufacture of sophisticated medical devices. India’s medical devices industry is sized at $5.2 billion, according to the sector snap shot by Invest India, and it is estimated to reach $50 billion by 2025. India imports more than 90% of sophisticated devices. With rising disposable incomes Indians will likely spend more on modern healthcare. There are tremendous opportunities for U.S. providers in Diagnostic imaging/Consumables/Patient aids/Orthopedic prosthetics.
POWER GENERATION & DISTRIBUTION EQUIPMENT
The U.S. exports of turbojet engines to India were circa $94million in 2018, representing merely 3% of India’s total imports of this product. Renewable power generation, transmission, and distribution infrastructure will eventually replace thermal power capacity in India and majority of renewable energy will be added from increased solar capacity. This growth provides opportunities for engineering and component suppliers. With more investment in grid upgrades, renewable-energy integration, rural electrification, and smart metering there are opportunities for providers of advanced-analytics based products.
EDUCATION SERVICES
According to the University Grants Commission (UGC) (www.ugc.ac.in) and Ministry of Human Resource Development (www.mhrd.gov.in) statistics, India’s education system is maturing fast with 795 universities, including 360 state universities, 123 deemed universities, 47 central universities, 262 private universities, 91 Scientific institutes and thousands of private sector colleges. India has emerged as a strong market for investment in the education sector due to its increasing young population and a competitive service sector, particularly in software development, pharmaceuticals, life sciences and healthcare, which is likely to continue for some years.
According to the India Brand Equity Foundation (IBEF) (https://www.ibef.org/industry/education-sector-india. aspx), the education sector in India is estimated at $91.7 billion in FY18 and is expected to reach $101 billion in FY19. As per the 2017 Open Doors Report (http://www. iie.org/en/Research-and-Publications/Open-Doors#.V_ RGL2z7V9A) there were more than 186,000 Indian students studying in the U.S. Further, year 2017-18 witnessed more than 12% growth for Indian students in the U.S. India is currently considering educational reforms to allow foreign campuses in India to award degrees, which will likely offer additional opportunities for the U.S. higher education institutions in India.

TRAVEL SERVICES
Traditionally, this category has remained the biggest component in the total services exports of the U.S. to India with $13.4 billion worth of exports in 2017. The U.S. remains a big attraction for Indian tourists and the Indian students and the average 17% annual growth of travel service exports to India is likely to continue go steadily up over the next several years with India’s rising income patterns in the backdrop of fastest GDP growth prospects for at least a decade. However, the visa and immigration policies from the U.S. side are being revised and have raised concerns among Indian stake holders.
INSURANCE SERVICES
The U.S. exports of Insurance services to India registered exponential growth of 170% in 2017; however, in dollar terms the amount at $361 million is not very significant due to India’s restrictive policies in this sector currently. But in the times to come, high demand for non-life insurance services is expected to increase as the Indian market grows and matures. This may necessitate liberalization of policy welcoming foreign insurance service providers.
FEES FOR USE OF IPRS
This segment has lately been witnessing uptrends with significant average annual growth of 38% for the last five years. In the wake of India’s technological needs in future, export prospects seem promising in this area.
AUTOMOBILES AND AUTO COMPONENTS
Latest trends in this sector highlight India’s export of vehicles for the entire FY18 worth 2.9 billion to the US.; however, the share of India was less than 1% in the U.S. total automotive import market of $306 billion. India’s $51 billion auto components sector has been observing robust growth and is anticipated to reach $200 billion by FY26. The IBEF estimates that India’s exports of auto components could account for as much as 26% of the world market by 2021 and become 4th largest auto components industry by 2025. India is known for being a cost-effective base for manufacturing high quality auto components. The Automotive Mission Plan of the Government of India (AMP) highlights that the Indian automotive industry (both vehicles and auto components) has the potential to scale up exports to the extent of 35-40% of its overall output over the next ten years and become one of the major automotive export hubs of the world. According to the Engineering Exports Promotion Council of India, the U.S. has, reportedly, remained the topmost importer of the Indian auto components/parts in the current fiscal year despite trade war conditions since August 2018.
SEAFOOD
India is one of the world’s largest fish producers and top exporter of fish and fish products to all the major developed markets of the world such as US, Europe, and Middle East. According to the Seafood Exporters Association of India, with seafood shipments to the U.S. increasing to 33% of the total seafood exports, India has become the largest seafood supplier to the U.S. The seafood exports to the U.S.are expected to go up further in the coming years according to the Seafood Exporters Association of India. The U.S. imports of Indian seafood have been witnessing an impressive 32% average annual growth rate for the last five years.India holds a huge potential for fisheries with a long coastline spanning about 8,129 km in addition to inland water resources (rivers and canals, reservoirs, ponds, tanks, and brackish water).With a series of government initiatives and policy support, The Marine Products Exports Development Authority (MPEDA), forecasts that India will achieve an export target of $10 billion by 2022.
MACHINERY & MECHANICAL APPLIANCES
India’s exports to the U.S. are now witnessing shifting patterns from traditional items such as textiles, leather to machinery. In 2018, the U.S. imported $386 billion worth of electrical machinery and mechanical appliances; however, India’s share was minuscule at $3.5 billion. India’s total exports of this product were valued at more than $20 billion for the same period, and there is clearly lot of untapped potential in this category. India’s machinery exports to the U.S. have been rising steadily at an average annual rate of 11% for the last four years, and this upward trend is expected to continue in future as bilateral economic engagement between the two economies rise.
CHEMICALS & PHARMACEUTICALS
India is becoming a major source of pharmaceuticals for the U.S. which fulfils its demands through imports. In 2018, the U.S. imported more than $116 billion worth of pharmaceuticals from the world and India’s share was merely 5.6% ($6.5 billion) while India’s total exports of pharmaceuticals to the world were more than $14 billion. India’s pharmaceutical industry is emerging as very competitive with low cost production capacity, and it will likely increase its share in the U.S. import market as bilateral economic cooperation increases.
MINERAL FUELS AND OILS
India has recently emerged a major supplier of industrial oils for the last few years. This growing trend in this sector is expected to continue since the U.S. imports of this products are immense and India’s mineral oil production is growing. The U.S. imported $241 billion worth mineral fuels and oils in 2018; India’s total exports to the world were more than $48 billion, out of which exports to the U.S. were pegged at only $3.3 billion.

FOOTWEAR
The U.S. imports of footwear from India have been hovering around $400 million per year for the last few years. While there is a big market in the U.S. for footwear (with the U.S. total footwear imports worth $27 billion in 2018), India can focus on exports of this product to the U.S. India’s total footwear exports to the world in 2018 were nearly worth $3 billion.
FOOD & AGRICULTURAL PRODUCTS
Many agricultural products are exported from India and there are more opportunities in India for additional agricultural product exports. Experts observe that with few amendments and processing, agricultural export can be easily maximized.
India is a leading exporter of rice—both Basmati and non-Basmati—to the world, in addition to the second largest producer of wheat in the world. India can leverage this potential by exporting more milled products to the United States. India is the largest producer of bananas, Papayas, and mangoes. The global share of India is only 1% in fresh fruits export; a substantial scope is available to diversify in markets, such as the U.S. Likewise, export of processed fruits and juices from India offers big opportunities. Clearly, India has also focused on exports of cereals and cereal preparations (biscuits, corn flakes, bread) and other processed items like tomato sauce, pan masala, jiggery, cocoa products etc. India is also the leader of dairy production in the world.
COMPUTER SERVICES
Leading services imports from India to the U.S. are in the telecommunications, computer, and IT sector. The U.S. is a major export market for Indian IT services with approximately 55% share of the India’s global software services exports. According to the latest USITC data, India’s computer services exports at circa $5.6 billion grew 17% on top of 42% and 30% growth rates achieved in 2017 and 2016 respectively. These trends are expected to continue since India has become the digital capabilities hub of the world with around 75 per cent of global digital talent present in the country. With a mature on-shore and off shore services sector, the usage of emerging technologies in the Artificial Intelligence and Blockchains present India tremendous opportunities in exports of IT enabled services. According to the Electronic and Software Export Promotion Council of India and the NASSCOM estimates export earnings of India’s IT companies are projected to grow 7-9% to $135-137 billion in FY19 from $126 billion in IFY 2018. IBEF estimates that India’s IT Services industry is expected to grow to $350 billion by 2025.

TOURISM AND TRAVEL SERVICES
The U.S. spending in India on account of personal and business travel is witnessing growing patterns since 2015. The latest data shows that U.S. travelers spent $18.5 billion in 2017, registering an increase of 13% from the previous year level, followed by 11.6% growth in 2016. Tourism is India’s 3rd largest foreign exchange earner and contributes nearly 9% to the GDP; with increasing investments in the hotel and travel infrastructure and its emergence as a significant business player in the world, India expects to attract more and more travelers from developed countries, such as the US and the EU.

CONCLUSION
The U.S.–India trade relationship stands solid today with a promising future. The latest trends in increasing volumes of bilateral trade between the two economies point to complementarity of commercial interests. Reaching $238 billion by 2025 may not be very difficult to achieve given the present dynamics of the commercial engagement. The policy gaps in the trade dynamics of the two countries have led to several contentious issues albeit trade volumes have been steadily expanding, suggesting there is tremendous interest among the businesses from both sides and immense potential remains untapped. This potential may be unlocked with appropriate policy measures from both sides.
Trade Data Sources: U.S. International Trade Commission Trade Map, U.S. Census and Economic Bureau
